Measuring an electronic system means reading its quantities — voltage, current, resistance, waveform — on the real circuit, with instruments, to compare what it actually does with what was expected. Where simulation computes an ideal behaviour before wiring, measurement records the real behaviour once wired: it is the build’s moment of truth. This page is the entry hub for measurement: it lays out the method shared by all instruments and how to read their results, then points to the right instrument — from the multimeter (a single value) to the oscilloscope (a waveform over time).
What is it for?
A build that “should work” according to the schematic and the simulation does not always work on the bench: a cold solder joint, a tired battery, a component mounted backwards, an incompatible logic level. Measurement is the only way to know what is really going on. It is used to:
- diagnose — “why doesn’t it work?”: is there really 5 V on this pin? is the track continuous? does the signal come out of the sensor?
- validate — confirming that a sub-assembly produces the expected voltage, current or waveform, before integrating it;
- characterise — reading a usable value (actual supply voltage, frequency of a signal, duty cycle of a PWM) for a technical design file or a test report;
- compare with the model — putting the real trace side by side with the simulated curve and the datasheet: three facets of the same signal.
Measurement mostly happens in proof of concept (validating a real sub-assembly before mounting it) and in integration and testing (qualifying the assembled system). It does not replace simulation. It checks it.
Which instrument for which quantity?
Each instrument answers a different question. The first reflex is to choose the instrument from the quantity to observe.
| Instrument | Quantity measured | Question it answers |
|---|---|---|
| Multimeter | voltage, current, resistance, continuity (DC or slow values) | “what is the value here?” |
| Oscilloscope | voltage as a function of time (fast signals, waveform) | “what is the shape of this signal?” |
| Logic analyzer | logic states of several digital lines at once | ”what are these bus lines saying?” |
| Function generator (GBF) | injects a calibrated signal (it is not a measurement) | “how does the circuit react to this input?” |
The essential divide: the multimeter gives a value (a number, slowly), the oscilloscope shows a shape (the evolution over time, fast). Checking a power supply is multimeter work. Watching a PWM signal, a bouncing button or a serial frame calls for an oscilloscope.
Measurement method
Whatever the instrument, a measurement follows the same sequence.
- Choose the instrument and the function from the quantity (voltage, current, waveform…).
- Set the range. Start from the widest range then narrow down, or trust the auto-range — but never exceed the instrument’s stated maximum (see Pitfalls).
- Connect properly. This is the step that separates a measurement from a short circuit: the voltmeter goes in parallel, the ammeter in series, and the oscilloscope shares its ground with the circuit (see Pitfalls).
- Read the value or the curve, noting the unit and the scale.
- Compare with the expected value. A measurement is only worth something against an expected order of magnitude, as in simulation — a step covered just below.
Voltage limits
The project runs on extra-low voltage: batteries, USB, bench power supplies. Mains 230 V is not measured within the project. It is a different world of precautions, instruments and certifications → low voltage.
Interpreting a measurement
Reading off a figure is not enough: you still need to know what it is worth. Three steps, mirroring those of simulation.
Read the quantity. Identify the unit, the scale and the range before concluding. “2.5” means nothing without knowing whether these are volts, millivolts or amperes, nor whether the range is appropriate. On an oscilloscope, check the probe setting (×1 / ×10) before reading an amplitude.
Know the quality of the instrument. A measurement inherits the instrument’s defects: its actual accuracy (a matter of trueness and precision) is found in its own documentation, and the last displayed digit is not a guarantee (resolution is not accuracy). Worth keeping in mind before commenting on a deviation of a few percent.
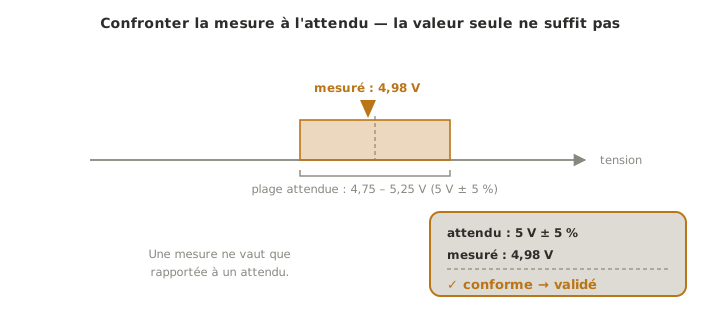
Compare with the expected value. Compare the measurement with what theory, the datasheet or the simulation predicts. A regulated 5 V supply must read between 4.75 and 5.25 V: if the multimeter reads 3.2 V, the supply is probably sagging under load. If it reads 0 V, a wire is missing. A measurement is first validated on a point whose answer is known (the voltage of a battery, a marked resistor).
Decide. Three outcomes: the sub-assembly is validated (it gets integrated). It is to be reworked (a value is not right, the build gets corrected). Or the measurement is absurd, and an absurd measurement most often betrays a wiring, range or ground problem, not exotic physics. Faced with the unbelievable, check the measurement itself first.
Warning
Measuring is not neutral. Connecting an instrument slightly changes the circuit: a voltmeter draws a little current from it, an oscilloscope probe adds capacitance. On ordinary builds the effect is negligible, but on a very high-impedance node a measurement can distort what it observes. The reflex: ask whether the instrument suits the point being measured.
Pitfalls
Ammeter in parallel = short circuit. An ammeter has near-zero resistance. Connecting it in parallel (like a voltmeter) creates a short circuit that blows its fuse, or worse, the build. Current is measured in series, by opening the circuit. It is the first cause of blown fuses (see multimeter).
Exceeding the range. Measuring 230 V on a range meant for 20 V, or clipping a probe onto a voltage above its limit, damages the instrument. When in doubt, start wide.
Forgetting the common ground (oscilloscope). The ground of a bench oscilloscope is tied to the mains earth: clipping its ground lead onto a point that is not the circuit ground creates a short circuit through the earth. Always connect the probe’s ground to the circuit ground (see oscilloscope).
Mixing up the natures. Reading an AC voltage on the DC range (or the reverse), confusing RMS, peak and peak-to-peak, forgetting that a resistance measurement is done with power off: all errors that give a wrong but readable figure.
Trusting the instrument without a cross-check. A displayed number is only information against an expected value. Before measuring, ask yourself “what value should I find?“.
Where it fits in the project
- Proof of concept phase — measuring a real sub-assembly (power supply, sensor stage, control signal) to confirm it behaves as intended before integrating it. Measurement turns “it should work” into “it works, measured”.
- Integration and testing phase — the instruments provide the readings that qualify the assembled system and feed the test report.
- From model to reality — the simulated curve is the expectation, the oscilloscope trace is the observation: ideal simulation, normative datasheet, real measurement, three facets of the same signal (see timing diagram).
See also
- Multimeter — measuring voltage, current, resistance, continuity (tool tutorial)
- Oscilloscope — watching a waveform over time (tool tutorial)
- Function generator (GBF) — injecting a calibrated signal: testing with a known stimulus (tool tutorial)
- Logic analyzer — following and decoding several digital lines (tool tutorial)
- Accuracy, trueness, precision — what the displayed figure is really worth
- Electronic simulation — the software counterpart: computing the expected value before wiring
- Timing diagram — reading a waveform, ideal or real
- Analysing an electronic schematic — knowing what you measure before measuring it (prerequisite)
- Logic levels — knowing the thresholds to measure, and not exceeding the range
- Reading a datasheet — where the expected value comes from