The logic analyzer watches several digital lines at the same time and keeps only their logic states — 0 or 1 — with timestamps. Where the oscilloscope shows the analog shape of one or two channels, the analyzer follows eight or sixteen and can decode protocols: it turns the pulses of a bus into readable bytes. It is the instrument for debugging communication buses. This is a tool tutorial of the measuring instruments hub.

What is it for?
When a sensor “does not respond”, the code tells you nothing: the question is what actually travels on the wires. The logic analyzer is there to:
- see for yourself that a frame leaves and arrives — or does not: is the address sent? does the peripheral (historically the slave) answer ACK?
- decode a UART, I²C or SPI frame into readable bytes, instead of counting edges by hand;
- follow several synchronous lines: the four signals of an SPI bus are watched together, which a two-channel oscilloscope cannot do;
- compare the real timing diagram with the expected timing diagram from the datasheet.
Interpreting the decoded frames — who talks, in what order, with which addresses — remains the business of each bus page: the analyzer simply makes them visible.
Getting equipped
The project does not require a laboratory instrument. This table is there to recognise the one you have in hand and to know what it can do:
| Instrument | What it can do |
|---|---|
| 8-channel USB clone (the “24 MHz, 8 CH” type) | eight lines sampled at up to 24 Msamples/s, far above the UART, I²C and SPI of a project; natively recognised by free software, so no proprietary driver to install |
| PulseView (from the free sigrok suite) | drives these clones and ships the UART / I²C / SPI decoders — this is the software described in this page |
| Saleae Logic 8 | the professional reference: greater capture depth and a more comfortable program. When the laboratory has one, that is the one to take |
Connect and capture
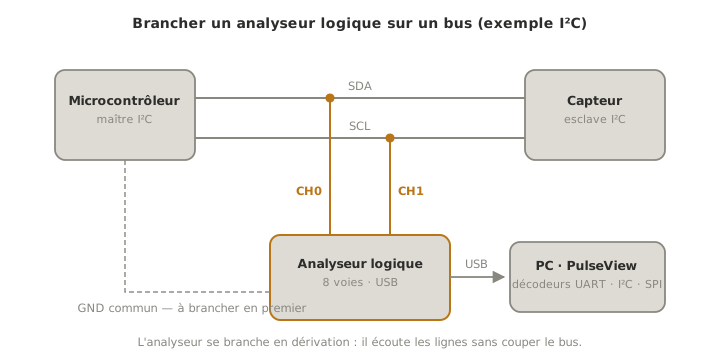
- GND first: connect one ground of the analyzer to the ground of the circuit — without a common reference, the readings are meaningless.
- Clip the channels onto the lines to watch: SDA + SCL for I²C, TX + RX for UART, CS + CLK + MOSI + MISO for SPI.
- Name the channels in the software — “CH0” says nothing, “SDA” does.
- Choose the sampling rate: at least four times the fastest signal being watched — ten times to be comfortable.
- Capture, then enable the decoder for the protocol: the pulses become bytes.
Pitfalls
Looking for analog in it. The analyzer slices everything into 0 / 1: a bouncing button, a slow edge, a level degraded by a track that is too long are invisible to it. It will display a beautiful square signal where the oscilloscope would show the problem. When in doubt about the quality of a signal, take the oscilloscope.
Exceeding the input voltage. USB clones tolerate 5 V, hardly more: no measurement on a 12 V or 24 V rail without adaptation.
Sampling too slowly. Undersampled, a bus produces a plausible but wrong frame — the most treacherous error, because nothing signals the aliasing. If the decoding looks inconsistent: raise the sampling rate before suspecting the circuit.
Forgetting the common ground. First step of the wiring, first cause of garbage captures.
Where it fits in the project
- Proof of concept phase — validating the microcontroller ↔ sensor dialogue from the very first wiring: the I²C address answers, the expected bytes flow.
- Integration and testing phase — debugging the exchanges between assembled sub-systems, with frame captures as evidence for the test report → hardening and debugging.
See also
- Measuring instruments — the hub: common method and choice of instrument
- Oscilloscope — the analog complement: the quality of the signal, not just its states
- UART · I²C · SPI — the protocols the analyzer decodes
- Timing diagram — reading what the analyzer displays
- Wokwi — its virtual logic analyzer, to capture a simulated bus before wiring anything