Debugging an Arduino program means working out why a sketch does not behave as expected, by watching its internal state while it runs. Unlike development on a computer, where graphical debuggers come as standard, the classic Arduino ecosystem rests mainly on well-placed Serial.print() calls. The IDE 2.x and some boards (Uno R4, Zero, MKR) add a real breakpoint debugger, but print() remains the universal tool to learn first.
What is it for?
Any embedded project quickly outgrows the point where you can check everything by eye on the sketch. Typical cases where debugging becomes necessary:
- The program hangs somewhere you cannot identify (a loop that stops going round).
- A sensor reading is nonsense without your knowing whether the bug is in the reading, the conversion, or the display.
- Random behaviour (sometimes fine, sometimes not) that you cannot reproduce.
- A function returns a strange value you cannot account for.
The discipline of debugging (observe before you change) is what separates a quick fix from a whole night of blind edits.
Step by step
Four steps: place print() calls where they count, check the compiled version is the one you are watching, compare expected against observed, use the debugger when one is available.
1. Well-placed Serial.print()
The basic tool: print the value of the critical variables to the serial monitor to follow the execution.
void loop() {
  int valeurBrute = analogRead(A0);
  Serial.print("Lecture brute : "); Serial.println(valeurBrute);

  float tension = valeurBrute * 5.0 / 1023.0;
  Serial.print("Tension : "); Serial.print(tension); Serial.println(" V");

  if (tension > 2.5) {
    Serial.println("Au-dessus du seuil");
    digitalWrite(LED_BUILTIN, HIGH);
  } else {
    Serial.println("En dessous du seuil");
    digitalWrite(LED_BUILTIN, LOW);
  }
  delay(500);
}
At every step of the calculation, you print what you observe. If the value is what you expect, you move on. If it is nonsense, you have the bug.
A tip: prefix the prints with a marker ([DBG], [ERR], the name of the function) so you can filter them mentally when the monitor scrolls.
2. Check the compiled version is the one you are watching
A classic mistake: changing the code and still watching the behaviour of the previous version because you forgot to upload. Signs to check:
- Does the IDE say “Téléversement terminé” (Upload complete) after every change?
- Does the serial monitor really show the new
print()calls you added? - Is the COM port the one of the right board (when several Arduino boards are plugged in)?
When in doubt, write a Serial.println("Version 23 - " __DATE__ " - " __TIME__); in setup(): the compiler substitutes the date and time of compilation, and you see straight away whether this is the latest version.
3. Compare what you observe against what you expect
At every print(), ask yourself: “what value should appear?“. If the observed value matches, the bug is further on. If it does not, the bug is between the last correct print() and this one.
That is the principle of debugging by bisection: place markers at both ends of a suspect block, see where observation diverges from expectation, close in.
4. Use a real debugger (on a compatible board)
On the Arduino Uno R4 Minima, Zero, MKR, Nano 33 IoT and Portenta boards, the IDE 2.x includes a breakpoint debugger, a feature absent on the Uno R3 and AVR clones.
The procedure:
- Select the compatible board (Tools → Board).
- Debug mode (Sketch → Optimize for Debugging).
- Upload.
- Place a breakpoint by clicking to the left of the line number.
- Start the debugger (the icon at the top right of the IDE 2.x).
- The program pauses at the breakpoint — inspect the variables in the right-hand panel.

Working out where the problem is
A program fails in two quite distinct ways, and what to do differs:
- It does not compile: the compiler refuses to produce the program and shows an error message. The bug is syntactic — read the message (next section).
- It compiles but does not do what you want: the syntax is fine, the logic is not. No message, no lead on screen. That is the most disorienting moment, and it is where the method (observe, compare, bisect) earns its keep.
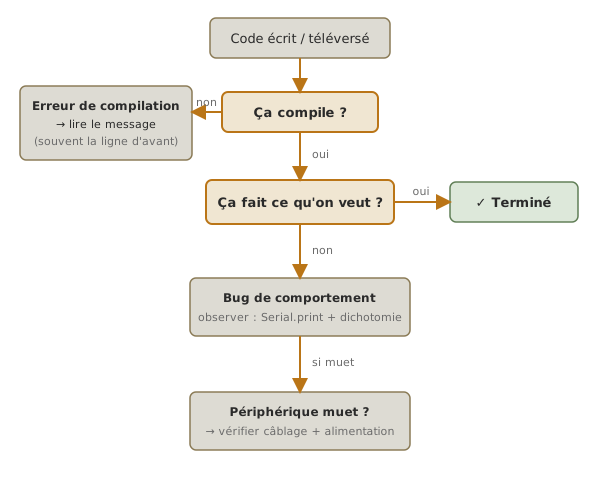
When it does not compile — read the error message
The compiler is harsh but honest: it refuses as long as a syntax error remains, and it shows (almost) where it is. Learning to read its messages saves a considerable amount of time: it is the most frequent error when starting out.
- Read the first message, not the forty that follow. A single mistake — a brace, a missing
;— often derails the compiler, which then spews dozens of cascading errors. Fix the first, recompile: most of the others disappear. - The error is often on the line above the one reported.
expected ';' before ...reported on line 12 nearly always means a;is missing at the end of line 11: the compiler only notices the omission when it reaches the next word. 'xxx' was not declared in this scope— the namexxxis unknown here. Causes: a typing or case mistake (maLed≠maLED), a variable declared in another block (scope → see C++), a forgotten#include, or a variable used before it is declared.expected '}' at end of input— an opening brace{was never closed. Reindenting the code makes the crooked block stand out. Clicking next to a brace makes the IDE highlight its match.no matching function for call to '...'— the function exists but you are calling it with the wrong number or type of arguments (saydigitalWrite(13)without theHIGH/LOWstate). Check its signature.- Invisible characters (
stray '\357', curly quotes). A copy-paste from the web sometimes slips in “curly” quotes (“ ”) instead of straight ones, or a non-breaking space. Retyping the line by hand clears up the mystery.
When it compiles but does not do what you want
This is the stage that throws people most: it compiles only means the syntax is correct, not that the program does what you imagine. Here there is no error shown: you have to observe (Serial.print and bisection, see the Step by step above) and to know the most common logic traps.
=instead of==in a test.if (etat = HIGH)assignsHIGHtoetatinstead of comparing it: the condition is then always true. To compare, it is always==.Serial.begin()forgotten. Noprintappears although the code looks right. Check thatSerial.begin(115200);really is insetup().- Monitor rate ≠
Serial.begin(). The monitor shows gibberish. Set its speed (the selector at the bottom right) to the same value asSerial.begin()(see Arduino serial monitor). pinMode()forgotten. A pin not declaredOUTPUTdrives nothing. An input with noINPUT_PULLUPfloats and reads anything. Configure every pin insetup()— see Configuring Arduino GPIO.INPUT_PULLUPand inverted logic. With the internal pull-up, the pin sits atHIGHat rest and falls toLOWon the press: so you test== LOW, not== HIGH. It is the most frequent button mistake.- Integer division.
analogRead(A0) * 5 / 1023computed in integers often lands on 0 (5 / 1023is 0 as soon as it is evaluated between integers). Write5.0(a float) to force real arithmetic. See C++. millis()stored in anint.millis()returns anunsigned longthat passes 32 767 in 33 seconds. Storing it in anintcauses an overflow and absurd time comparisons. Alwaysunsigned longfor durations.- Comparing two
floatvalues with==.if (tension == 2.5)is nearly always false: floats carry rounding errors. Test an interval:if (abs(tension - 2.5) < 0.01). delay()freezing everything. Duringdelay(1000), nothing else runs — no button reading, no other task. “The button only answers every other time” is often adelayblocking the way. See Timing delays.- Array index out of bounds.
int t[4];thent[4] = ...writes past the array (the indices run 0 to 3). A disorienting symptom: some other variable changes on its own. Indices run from0tosize - 1. - Uninitialised variable.
int compteur;thencompteur++starts from an undefined value. Always initialise:int compteur = 0;. setup/loopmisspelt.void Setup()(with a capital) or any near miss compiles as an ordinary function that is never called: the program does nothing, with no error at all. Write exactlysetup()andloop()in lower case.
None of these mistakes produces a message: that is precisely why the method — observe with Serial.print, compare expected against observed, close in by bisection — is the only way out.
The code says one thing, the wiring says another
The program can be right and the wiring wrong. The wiring can be right and the code wrong. Both often give the same symptom (“nothing happens”), and it is one of the most frequent sticking points in a lab session. The key: the pin number in the code is the physical address of the component. digitalWrite(8, HIGH) is a promise that a wire runs from D8 to the component — not D7, not D9. You lose that link because the code handles abstract numbers while the breadboard is a field of identical holes.
The way out is bisection, applied to the code-and-hardware boundary. Isolate the two halves:
- Prove the board and the upload with the built-in LED flashing (
LED_BUILTIN), with nothing wired at all. If it flashes, the IDE-to-board chain works. The problem is downstream. - Prove the wiring with a minimal sketch that only drives (or only reads) the suspect pin — a
digitalWritethat flashes, ananalogReadprinted to the monitor. If the component reacts, the wiring is good: the bug is in the logic of the main program. - Trace the wire from the pin named in the code to the component: read
const int LED = 8;, put your finger on D8, follow the wire. Nine times out of ten, the mistake jumps out at that moment. - Check the role and the polarity, not just the number. A pin declared
OUTPUTbut wired to a sensor (an input), or an LED tied toGNDwhile the code thinks it is active high: the number is right, but the direction does not match. Code and wiring have to agree on the number, the direction (INPUT/OUTPUT) and the polarity (active high / active low).
Two disciplines keep that link readable: naming the pins with constants (const int LED_ROUGE = 8; rather than 8 repeated in place, the code then reads like the wiring), and reading this wiki’s wiring diagrams alongside the code: their pins carry the same names as the sketch (IN1 → D12, SDA → A4). The example below applies exactly that logic of isolation, from the sensor out to the output.
Example — Diagnosing an ultrasonic sensor that returns 0
A real case: you have wired an HC-SR04, the code runs, but the distance shown is always 0 or very strange. A structured approach.
Step 1 — Check the code really receives a signal:
unsigned long duree = pulseIn(ECHO, HIGH, 30000UL);
Serial.print("Duree pulseIn : "); Serial.println(duree);
If duree is always 0 → the echo is not coming back. Possible causes: Trig badly wired, sensor not powered, incompatible 5 V level (the ESP32 case). Check with a multimeter that Trig really receives a pulse (a transient 5 V).
Step 2 — Check the distance calculation:
float distance_cm = duree * 0.0343 / 2;
Serial.print("Distance calculee : "); Serial.println(distance_cm);
If duree is consistent (~580 µs for 10 cm) but distance_cm is nonsense → a mistake in the formula (the coefficient, a forgotten /2, or mixed units).
Step 3 — Check the value reaches what comes next:
if (distance_cm < SEUIL_CM) {
  Serial.println("Sous le seuil — allumer LED");
  digitalWrite(LED, HIGH);
}
If distance_cm is right but the LED does not light → a mistake in the condition (an inverted sign, the threshold value) or in the LED wiring.
This onion-skin approach (from the sensor out to the output) quickly isolates the faulty segment.
Pitfalls
Serial.print() changing the timing of the code. A print() at 9600 baud blocks for ~1 ms per character sent. In a critical loop (a control loop, fast encoder reading), adding print calls can break the timing and change the very behaviour you are trying to watch. Fix: move to 115200 or 230400 baud, or call Serial.print() at a reduced rate (every 100 ms through millis()).
Printing just after opening the monitor. The IDE’s serial monitor takes ~1-2 seconds to open after an upload. The print() calls in setup() can go unnoticed. Add delay(2000) or while (!Serial); (on boards with native USB) at the top of setup() to wait for it to open.
Watching a variable out of scope. Printing a local variable only means something inside the block where it exists. If you copy a print elsewhere, the compiler raises an error, easy to fix but frustrating to diagnose if the variable has a close namesake.
Serial.print() left in production. A final build that talks to the computer all the time eats CPU, degrades latency and is slower to start. The discipline: every debug print goes behind a macro you can switch off in one place:
#define DEBUG 1
#if DEBUG
  #define DBG_PRINT(x) Serial.print(x)
  #define DBG_PRINTLN(x) Serial.println(x)
#else
  #define DBG_PRINT(x)
  #define DBG_PRINTLN(x)
#endif
A breakpoint that never fires. On debug-capable boards, forgetting to switch to debug mode (Optimize for Debugging) compiles a release build where the optimisations can remove or reorder the code: the breakpoint points at an instruction that no longer exists.
The Heisenberg bug. Simply adding a print (or setting a breakpoint) slows the code enough to make the bug disappear. That is often the sign of a race condition or a timing dependency. Diagnosis: watch without print but with an LED toggle marking the passes through a function.
Confusing a missing printout with code that never ran. If a print() does not appear, there are two hypotheses: the line is not reached, OR Serial.begin() was never called. Check the initialisation before concluding the block is not reached.
Special case — Advanced logging libraries
For serious projects, several libraries structure the debugging beyond the bare print():
ArduinoLog— log levels (verbose, notice, warning, error, fatal), filtering, formatting.SerialDebug— conditional prints that can be switched on live by command.telneton the ESP32 — watching the logs without even plugging in the USB.
Worth considering as soon as you go past 50 print() calls scattered through a project.
Where it fits in the project
- Step 3 of the proof of concept phase — a PoC with no
printis a PoC you troubleshoot badly. Investing 5 minutes inprint()calls early saves hours of wandering later. - Step 1 of the integration and testing phase — instrumentation through logging directly conditions the quality of the pyramid of tests.
- Step 4 of the integration and testing phase — hunting intermittent bugs rests on logging every interesting variable continuously, then analysing after the fact.
Debugging is less a stroke of genius than a method: observe, compare, bisect. Doing it mechanically, without panicking, is what makes the difference between a project that converges and one that drags on.
See also
- Arduino — hub of the Arduino tutorials
- Serial monitor — the prerequisite for using
Serial.print() - C++ for Arduino — types, scope, integer division: the root of a great many basic mistakes
- Reading a program you did not write — the step before: understanding code without assuming a fault
- Inputs and outputs (GPIO) —
pinMode, pull-ups and pin logic - Timing delays — to pace the
printcalls without flooding - Firmware — the wider organisation of embedded code
- Debugging an embedded system — the cross-cutting view: investigation method and hardware debugging (JTAG/SWD)
- Watchdog on Arduino — for the silent hangs of a program