A flowchart (called logigramme, organigramme or ordinogramme in French) is a graphical representation of an algorithm as a chain of standardised symbols (ISO 5807) — start/end, processes, decisions — joined by arrows that follow the flow of execution. It describes a branching treatment well (if… then… else, loops), where a state machine describes a system with modes.
What is it for?
When a behaviour is described as “you read this, then if such a condition then you do that, else something else”, a flowchart lays that logic out flat before you code it. It serves to:
- walk through a procedure step by step, making every decision and every branch visible;
- spot the forgotten cases — a decision with a branch that leads nowhere leaps out of the diagram;
- communicate a treatment’s logic without committing to a programming language;
- prepare the code: every diamond becomes an
if, every rectangle an instruction.
It is the natural tool for a one-off sequential treatment with branches. As soon as the system has lasting modes (running / faulted / idle), the flowchart swells and becomes unreadable: that is the signal to move to a state machine.
How to read a flowchart
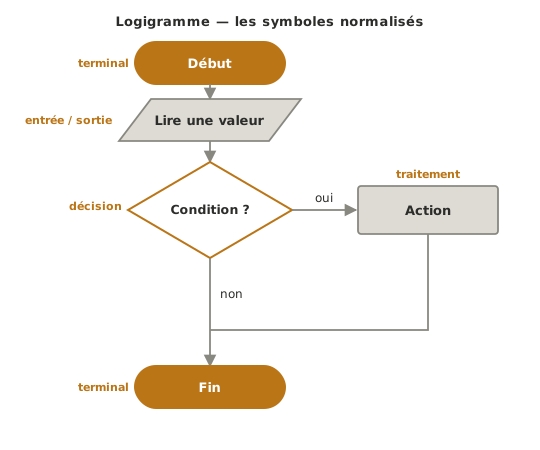
Four symbols cover most flowcharts, joined by arrows that give the reading direction (top to bottom by convention).
- Terminal (stadium shape) — marks the start and the end. A flowchart starts with a single start and finishes with at least one end. There is one exception, and it is deliberate: an embedded program that runs forever has no end, its main loop stands in for one (see the target version in the example).
- Input / output (parallelogram) — data coming in (reading a sensor) or going out (displaying, sending).
- Process (rectangle) — an action or a calculation (“increment”, “switch the heating off”).
- Decision (diamond) — a condition with two labelled outputs. The diagrams here are the French ones, so the labels read
ouiandnon, that is yes and no. It is the only symbol with more than one output.
Three rules for reading well. The flow only splits at a diamond, and both its outputs are always named. The branches join back up afterwards, or each leads to an end. And every path terminates: a line that stops in mid-air is a mistake, not a shortcut.
Example — Thermostat
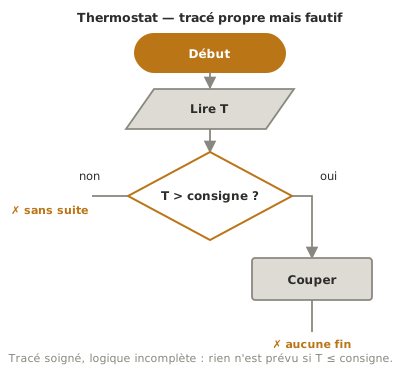
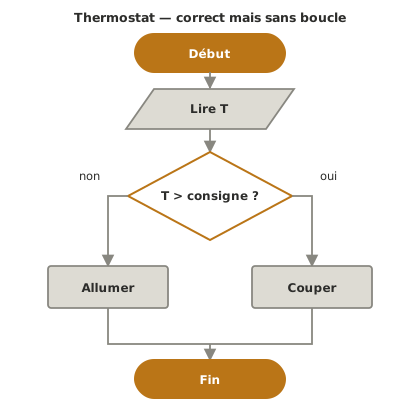
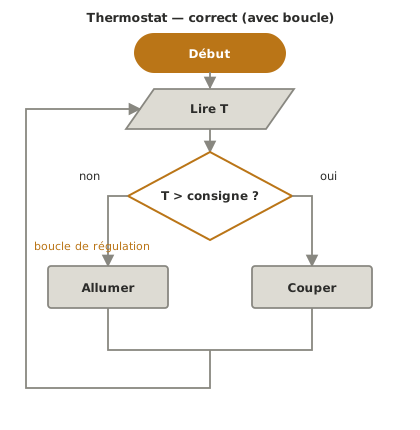
The same thermostat, “if the temperature goes above the setpoint, switch the heating off, otherwise heat”, in three versions, from the faulty drawing to the flowchart you can work from.
Counter-example — cleanly drawn but wrong
Why this is bad. The drawing is careful — correct symbols, clean arrows — but the logic has a hole in it. Only one branch of the decision is dealt with: what happens if the temperature is below the setpoint? Nothing is provided for. And the flow stops in mid-air, with no end terminal. A well-drawn diagram can be every bit as wrong as a scruffy one: neatness does not validate logic.
The real cost. Translated as it stands, the code does nothing in half the cases, and nobody notices until the heating stays stuck. The bug is in the branch that never got drawn.
Middling version — correct but with no loop
Why this is middling. Both branches are dealt with and the flow terminates properly: the logic is right. But the loop is missing. The program reads the temperature once, acts, and stops. A thermostat has to regulate continuously. The flowchart is correct for a one-off treatment, incomplete for regulation.
Target version — complete logic, with a loop
Why this is good. Both cases are covered, and a loop takes the flow back to reading the temperature: regulation runs permanently. Every symbol turns straight into code — the diamond into an
if(conditions), the rectangles into actions, the loop intowhileorloop()(loops). This is a flowchart you can code without guessing at anything.
Pitfalls
A decision with only one output. A diamond always has two labelled outputs. Forgetting the “no” branch (or the “yes” one) leaves a case unhandled, the most frequent and the most silent mistake of all.
A flow that does not terminate. A line that stops in mid-air is not an end. Every path has to join another path or reach an end terminal.
A loop with no way out. A loop that comes round again with no decision allowing you to leave it is an infinite loop. Continuous regulation is intended. A blocking loop is not.
Arrows that cross. Once the connections cross over each other, the flowchart becomes unreadable. It is often a sign that the blocks need rearranging, or that the behaviour belongs in a state machine.
Too much detail. A flowchart describes logic, not every line of code. Copying variable declarations or exact syntax into it drowns it. Stay at the level of decisions and actions.
Mixing it up with an organisation chart. The French word organigramme means both this diagram and the tree of an organisation’s functions or people, which is where the confusion comes from. Here it is the execution flow of an algorithm, nothing else.
See also
- Algorithm — the parent page, which places the flowchart among the representations
- State machine — to be preferred as soon as the system has lasting modes
- GRAFCET — for a sequence, especially one with actions in parallel
- Timing diagram — for reasoning about time rather than about decisions
- Proof of concept — where the flowchart you designed gets coded and tested