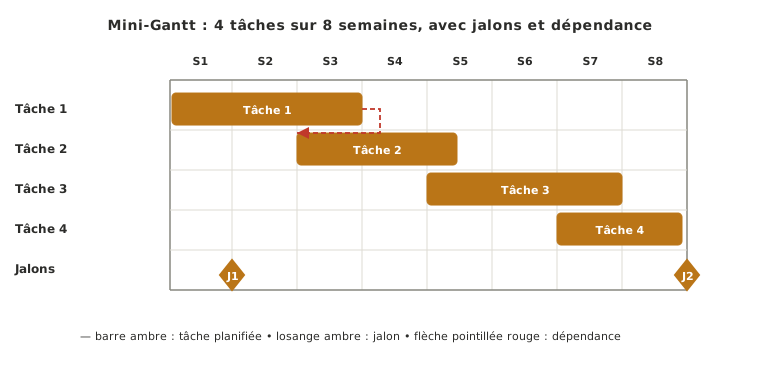
The Gantt chart (or Gantt diagram) is the graphical tool that gives shape to a backward plan: tasks in rows, calendar in columns, horizontal bars showing durations and overlaps. Its teaching strength is that it brings out visually the dependencies between tasks and the bottlenecks where several tasks overlap dangerously.
What is it for?
The Gantt chart makes the time sequence of a project visible at a glance. Where a WBS says what and a backward plan says when, the Gantt chart lays one over the other on a single graphical support. That is what lets you see rather than read.
Three roles:
- Making the critical dependencies visible between tasks — this task blocked by that one, this delivery gating the start of the next. The dependency arrows are what tells a Gantt chart apart from a plain list dropped onto a timeline.
- Spotting the calendar bottlenecks where several tasks overlap dangerously. If three critical tasks land in the same week, you see it before the week arrives.
- Acting as a communication support in review. Milestones and tasks can be read by an outside reader (supervisor, client) with no prior context, useful as soon as the state of the project has to be presented.
How do you build one?
Five steps:
- Take the task list from the WBS and their estimated durations.
- Put the milestones on the time axis in columns as fixed points.
- Draw one horizontal bar per task between its start date and its end date.
- Add the dependencies as arrows linking the tasks that necessarily follow one another.
- Update at every phase review. Without that, the Gantt chart lies from the first slip onwards.
On the tooling side, three main options are available: Excel or paper (quick to set up, enough for a simple Gantt chart), GanttProject (dedicated free software, handles dependencies cleanly), Trello (kanban task tracking, a useful complement to the Gantt chart but not a replacement for it: the continuous time dimension is lost). Choose one tool and stick to it. Scattering the planning across three unsynchronised supports is worse than one imperfect tool.
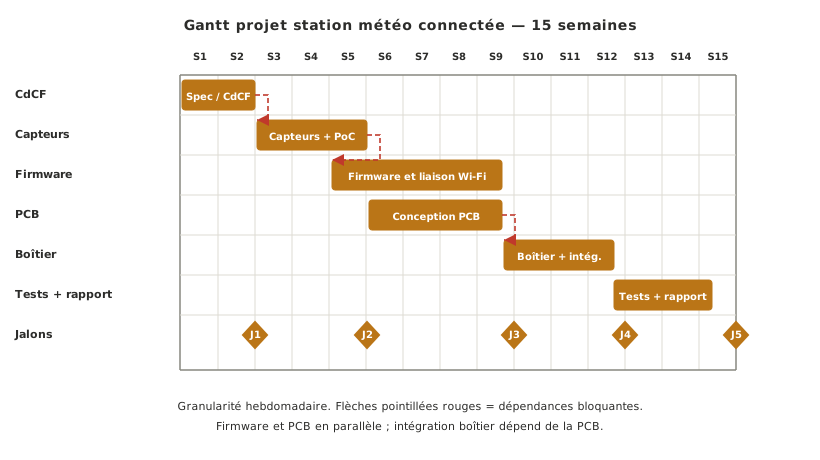
A worked case: the Gantt chart of a connected weather station project over 15 weeks.
Pitfalls
A Gantt chart frozen once produced. A Gantt chart drawn at the start of a phase and never reopened lies from the first slip onwards. Conversely, a Gantt chart updated every week, however imperfect, becomes a powerful steering tool: it reveals the slips early, while there is still room to act.
Too fine-grained. A day-by-day Gantt chart on a project running several months becomes unreadable and demoralising. Every delay of a few days shows up as a crisis. Weekly granularity is enough on a school project.
No visible dependencies. A Gantt chart with no dependency arrows is just a list of tasks dropped onto a timeline. The teaching value lies precisely in showing who blocks whom. A delay on the PCB order can push three integration tasks back.
See also
- Technical specification — step 5, where the project Gantt chart is built
- Backward planning — the time plan the Gantt chart gives shape to
- WBS — the work breakdown whose leaves become the bars of the Gantt chart
- Milestones — fixed points put on the Gantt chart before the tasks
- Project planning and tracking — the cross-cutting thread that keeps the Gantt chart alive